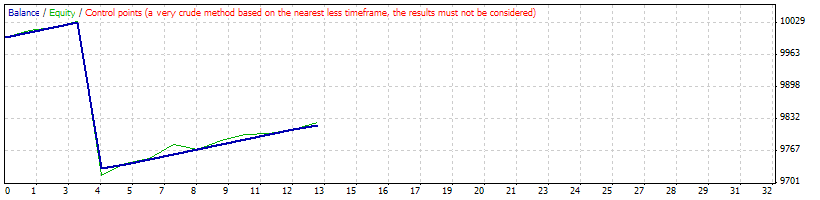
Strategy Tester Report
AlpariUK-Demo (Build 225)
| Symbol | EURUSD (Euro vs US Dollar) | ||||
| Period | 1 Hour (H1) 2009.12.01 00:00 - 2010.01.15 22:00 (2009.12.01 - 2010.01.17) | ||||
| Model | Control points (a very crude method, the results must not be considered) | ||||
| Parameters | TakeProfit=100; StopLoss=3000; | ||||
| Bars in test | 1753 | Ticks modelled | 19953 | Modelling quality | n/a |
| Mismatched charts errors | 1 | ||||
| Initial deposit | 10000.00 | ||||
| Total net profit | -179.92 | Gross profit | 120.00 | Gross loss | -299.92 |
| Profit factor | 0.40 | Expected payoff | -13.84 | ||
| Absolute drawdown | 324.52 | Maximal drawdown | 363.52 (3.62%) | Relative drawdown | 3.62% (363.52) |
| Total trades | 13 | Short positions (won %) | 2 (100.00%) | Long positions (won %) | 11 (90.91%) |
| Profit trades (% of total) | 12 (92.31%) | Loss trades (% of total) | 1 (7.69%) | ||
| Largest | profit trade | 10.00 | loss trade | -299.92 | |
| Average | profit trade | 10.00 | loss trade | -299.92 | |
| Maximum | consecutive wins (profit in money) | 9 (90.00) | consecutive losses (loss in money) | 1 (-299.92) | |
| Maximal | consecutive profit (count of wins) | 90.00 (9) | consecutive loss (count of losses) | -299.92 (1) | |
| Average | consecutive wins | 6 | consecutive losses | 1 | |
| # | Time | Type | Order | Size | Price | S / L | T / P | Profit | Balance |
| 1 | 2009.12.03 04:10 | buy | 1 | 0.10 | 1.50919 | 1.47919 | 1.51019 | ||
| 2 | 2009.12.03 07:45 | t/p | 1 | 0.10 | 1.51019 | 1.47919 | 1.51019 | 10.00 | 10010.00 |
| 3 | 2009.12.10 15:10 | buy | 2 | 0.10 | 1.47494 | 1.44494 | 1.47594 | ||
| 4 | 2009.12.10 15:20 | t/p | 2 | 0.10 | 1.47594 | 1.44494 | 1.47594 | 10.00 | 10020.00 |
| 5 | 2009.12.11 07:00 | buy | 3 | 0.10 | 1.47385 | 1.44385 | 1.47485 | ||
| 6 | 2009.12.11 09:50 | t/p | 3 | 0.10 | 1.47485 | 1.44385 | 1.47485 | 10.00 | 10030.00 |
| 7 | 2009.12.16 17:00 | buy | 4 | 0.10 | 1.45798 | 1.42798 | 1.45898 | ||
| 8 | 2009.12.18 16:50 | s/l | 4 | 0.10 | 1.42798 | 1.42798 | 1.45898 | -299.92 | 9730.08 |
| 9 | 2009.12.23 16:15 | buy | 5 | 0.10 | 1.43131 | 1.40131 | 1.43231 | ||
| 10 | 2009.12.23 16:20 | t/p | 5 | 0.10 | 1.43231 | 1.40131 | 1.43231 | 10.00 | 9740.08 |
| 11 | 2009.12.29 08:20 | buy | 6 | 0.10 | 1.44100 | 1.41100 | 1.44200 | ||
| 12 | 2009.12.29 08:50 | t/p | 6 | 0.10 | 1.44200 | 1.41100 | 1.44200 | 10.00 | 9750.08 |
| 13 | 2009.12.31 03:00 | buy | 7 | 0.10 | 1.43701 | 1.40701 | 1.43801 | ||
| 14 | 2009.12.31 07:33 | t/p | 7 | 0.10 | 1.43801 | 1.40701 | 1.43801 | 10.00 | 9760.08 |
| 15 | 2010.01.04 12:15 | buy | 8 | 0.10 | 1.44061 | 1.41061 | 1.44161 | ||
| 16 | 2010.01.04 12:20 | t/p | 8 | 0.10 | 1.44161 | 1.41061 | 1.44161 | 10.00 | 9770.08 |
| 17 | 2010.01.06 19:00 | buy | 9 | 0.10 | 1.44049 | 1.41049 | 1.44149 | ||
| 18 | 2010.01.06 20:15 | t/p | 9 | 0.10 | 1.44149 | 1.41049 | 1.44149 | 10.00 | 9780.08 |
| 19 | 2010.01.08 15:00 | buy | 10 | 0.10 | 1.44039 | 1.41039 | 1.44139 | ||
| 20 | 2010.01.08 19:15 | t/p | 10 | 0.10 | 1.44139 | 1.41039 | 1.44139 | 10.00 | 9790.08 |
| 21 | 2010.01.11 05:00 | sell | 11 | 0.10 | 1.45219 | 1.48219 | 1.45119 | ||
| 22 | 2010.01.11 05:40 | t/p | 11 | 0.10 | 1.45119 | 1.48219 | 1.45119 | 10.00 | 9800.08 |
| 23 | 2010.01.12 00:00 | sell | 12 | 0.10 | 1.45128 | 1.48128 | 1.45028 | ||
| 24 | 2010.01.12 01:10 | t/p | 12 | 0.10 | 1.45028 | 1.48128 | 1.45028 | 10.00 | 9810.08 |
| 25 | 2010.01.13 11:45 | buy | 13 | 0.10 | 1.45173 | 1.42173 | 1.45273 | ||
| 26 | 2010.01.13 12:15 | t/p | 13 | 0.10 | 1.45273 | 1.42173 | 1.45273 | 10.00 | 9820.08 |